

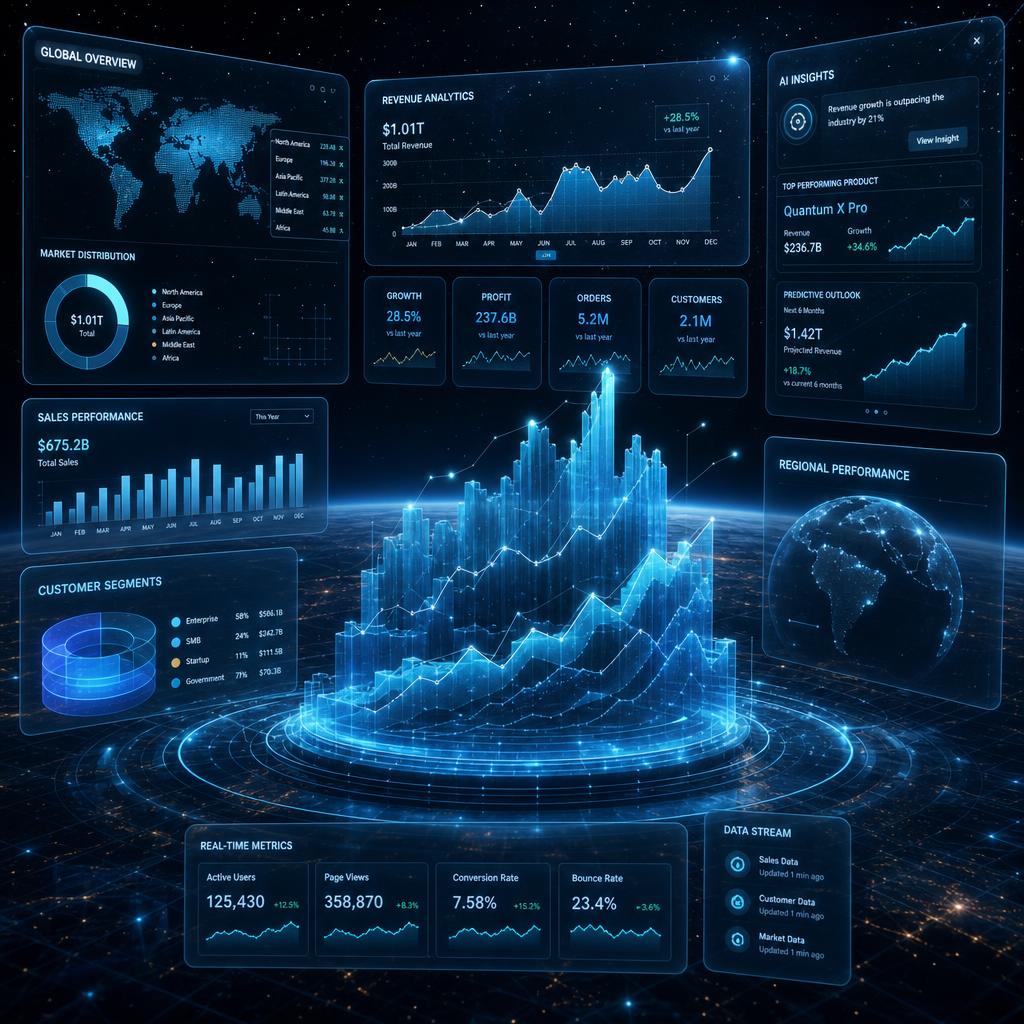
Data Analytics & Business Intelligence
Turn operational data into governed dashboards and self-service analytics that guide day-to-day decisions.
Data Analytics & Business Intelligence is the practice of collecting, modeling, and presenting enterprise data so decision-makers can act on trustworthy metrics. NexWEB Technologies builds semantic layers, curated data models, and interactive dashboards on top of your existing sources, then delivers self-service tooling so teams can explore data without waiting on engineering. We prioritize a single, consistent definition of key metrics and pair every rollout with governance and access controls. The result is faster, evidence-based decisions grounded in data your organization can rely on.
The Challenge
Enterprises frequently face severe operational and technical blockers when trying to scale or modernize in this domain. Typical issues include:
- Conflicting numbers reported by different teams and tools
- Manual, spreadsheet-driven reporting that is slow and error-prone
- Business users unable to answer their own questions without engineering help
What We Deliver
Semantic Modeling
Defining consistent, reusable metric definitions in a shared semantic layer so every report agrees.
Self-Service Analytics
Delivering governed exploration tools that let business users build their own views safely.
KPI Dashboards
Designing interactive dashboards that surface the metrics that drive operational and executive decisions.
Industry Use Cases
Retail & E-commerce
Unified sales, inventory, and marketing dashboards that expose margin and channel performance in one place.
Healthcare
Operational reporting on patient throughput and resource utilization to inform staffing and capacity planning.
Financial Services
Governed executive scorecards that consolidate portfolio and risk metrics from disparate systems.
Our Approach
Discovery & Metric Alignment
We interview stakeholders to catalog key questions and agree on authoritative definitions for each metric.
Modeling & Prototype
We build a curated data model and semantic layer, then validate it against a prototype dashboard with users.
Rollout & Enablement
We deploy dashboards with role-based access and train teams to use self-service exploration responsibly.
Iterate & Govern
We monitor usage, refine models as questions evolve, and maintain metric governance over time.
Why NexWEB Technologies
- A single source of truth for metrics that ends debates over whose numbers are right.
- Dashboards designed around real decisions, not vanity charts.
- Governance and access controls built in from day one, not bolted on later.
Frequently Asked Questions
Why do our teams report different numbers today?
Do you replace our existing BI tools?
How do you enable self-service without chaos?
How current will the dashboards be?
What happens as our questions change?
Technologies Used
Ideal For
Organizations that need trustworthy, self-service reporting across business and executive teams.
Related Services
Ready to execute?
Discuss your projectReady to modernize your mission-critical platforms?
Partner with NexWEB Technologies to securely implement enterprise AI, scale your cloud infrastructure, and build the software that runs your business.